The Real Cost of Cybersecurity Breaches: 2026 Data and Risk Analysis
TL;DR: Breach costs keep climbing. The global average hit $4.88M in 2024 and is tracking toward $5.1M in 2025, with healthcare leading at $10.9M per incident. The clearest cost lever is speed: AI-driven detection, zero-trust architecture, and tested response plans each cut costs by millions. The gap between well-defended and poorly-defended organizations is widening, and insurers are pricing it in.
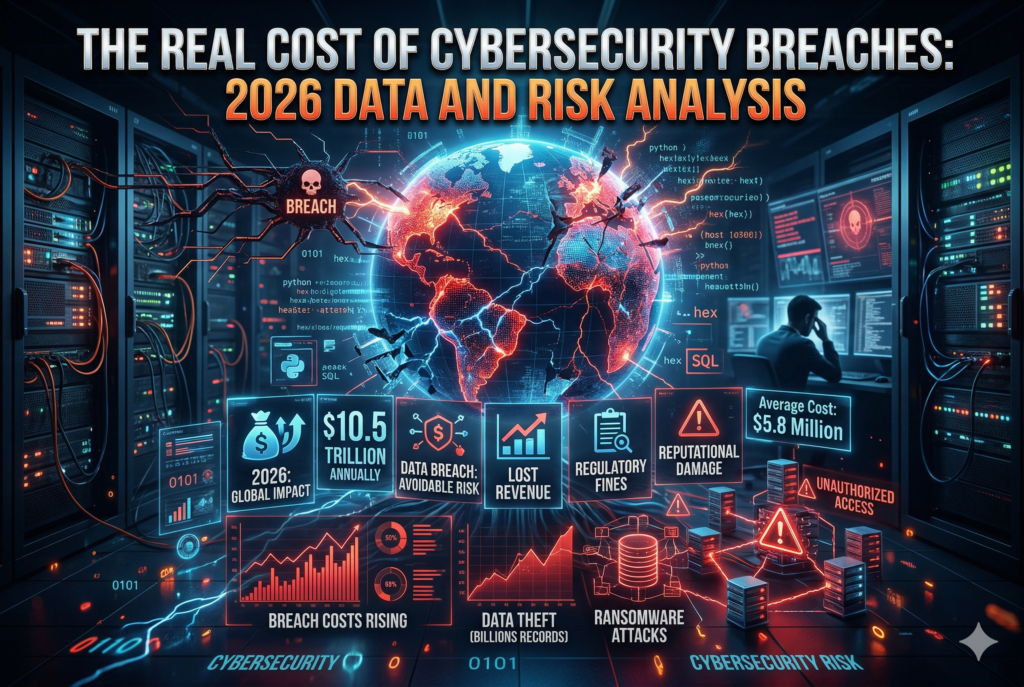
Breach costs have risen steadily for over a decade, but the 2023 to 2026 stretch set a new ceiling that is changing how organizations model cyber risk. The global average total cost of a data breach reached $4.88M in 2024, up 10% year over year and the highest figure since IBM and the Ponemon Institute began systematic measurement. Early 2025 estimates put the number at $5.1M, and the line shows no sign of flattening.
The headline figures need context. They mix Fortune 500 incidents with mid-market breaches, and mature security programs with shops still leaning on perimeter firewalls. The average hides a distribution with a long right tail. Plenty of organizations land well below the mean, while a handful of high-profile incidents drag the average sharply upward. Even accounting for that spread, the data is clear on one point: the floor for breach costs is rising, not just the ceiling.
The compounding matters most. A 10% annual increase against flat or barely-growing security budgets means the gap between prevention spend and post-breach cost keeps widening. That gap is the central tension in cybersecurity economics today.
Key Takeaways
- The global average total cost of a data breach reached $4.88M in 2024 and is estimated at $5.1M in 2025.
- Healthcare breaches stay the most expensive by industry, averaging $10.9M per incident in 2024.
- Organizations with heavy AI security tooling show breach costs 19% below the global mean.
- Mean time to identify and contain a breach averaged 292 days globally in 2025, down from 327 in 2022.
- Ransomware accounts for 24% of breaches by incident type but 35% of total breach cost exposure.
- Supply chain and third-party vendor attacks grew 26% in volume between 2023 and 2025.
- Organizations with mature zero-trust architectures show breach costs averaging 27% lower.
Breach Frequency, Attack Vector Distribution, and Industry Exposure
Reported breach incidents grew an estimated 15% annually between 2023 and 2025. Two forces drive that: real attack volume is rising, and detection has improved enough to surface incidents that once went undetected or unreported. The second factor is worth keeping in mind. Some of the apparent jump in frequency is a measurement artifact of better visibility, not purely more attackers.
Phishing and social engineering remain the most common entry method at roughly 41% of breach entry points. That share has held steady for years despite heavy investment in awareness training, because the asymmetry is brutal. Defenders have to stop every attempt; attackers only need one to land. Generative AI has stripped away the bad grammar and odd phrasing that used to tip off recipients and email filters alike.
Credential theft and reuse comes second at 19%, and it compounds. Every breach that exposes username and password pairs feeds a growing pool that attackers recycle against other targets. Compromised credential pairs on dark web markets passed 24 billion in 2024 and grow with every incident. Consumer password reuse still sits above 60% despite years of guidance, so a single leak from a low-security service can open the door to banking, email, and corporate accounts.
Software vulnerability exploitation grew to 15% of initial access vectors, driven by how quickly threat actors now weaponize published CVEs. The window from disclosure to active exploitation has compressed from weeks to days for high-value targets. Zero-day exploitation is still a smaller share by volume, but it has grown more frequent and drifted downstream from nation-state targets to commercial organizations, especially those running widely deployed enterprise software.
- 41% of breaches start with phishing or social engineering
- 24% of breach incidents involve ransomware
- 26% growth in supply chain attacks, 2023 to 2025
Ransomware accounts for 24% of incidents by count but 35% of total cost exposure. That disproportion reflects what ransomware does beyond exposing data. It halts operations, forces expensive recovery and rebuilding, triggers regulatory notification, and sometimes ends in a ransom payment. The average ransom demand hit $2.1M in 2024 across all victim sizes. Actual payment rates are harder to verify since many organizations stay quiet, but incident response data suggests a meaningful fraction pay, particularly when restoring from backup is not viable in an acceptable window.
The ransomware ecosystem has matured into a service economy. Ransomware-as-a-service operations hand affiliates tooling, infrastructure, and even negotiation support in exchange for a cut of payments. That model lowered the technical bar, which is one reason volume keeps climbing even as law enforcement disrupts major groups.
Supply chain attacks are the most dangerous structural trend. The 26% growth in supply chain and third-party vendor breaches between 2023 and 2025 reflects a simple realization among attackers: hit a widely-used software vendor and you can compromise thousands of downstream organizations through one intrusion. The economics favor the attacker, since one successful campaign against a build pipeline or managed service provider returns far more than chasing individual targets. Defenders face the inverse problem, because the malicious code or access arrives through a trusted channel.
Breach Cost Distribution and Industry Benchmarks
Healthcare’s $10.9M average sits at nearly twice the next-highest industry and more than double the global average. Several factors stack up. Healthcare records fetch higher black-market prices because they bundle personal identifiers with insurance and medical history, useful for identity, insurance, and prescription fraud at once. HIPAA penalty exposure for inadequate security can run into the millions per incident before any class action or state attorney general action. And healthcare operations are uniquely fragile: a hospital that cannot reach patient records cannot operate safely, so ransomware here carries patient-safety stakes other sectors do not face.
Organizations below $100 million in annual revenue that suffer a significant breach face a realistic risk of closure. The cost is not just financial. It is existential.
Financial services breaches average $6.1M per incident, a product of heavy regulatory scrutiny, mandatory disclosure, and the mix of customer financial data and internal operational data that makes these targets attractive. Banking regulators in most jurisdictions impose short notification windows and can levy substantial fines for weak security programs, layering compliance cost on top of direct incident cost.
Technology sector breaches average $5.4M, driven less by regulatory penalties and more by IP exposure, customer data volume, and the reputational sting of a security failure at a company whose products are supposed to be secure.
Company size correlates with breach cost in a non-linear way. Mid-market companies with 500 to 5,000 employees average $2.8M, lower in absolute terms than enterprise costs but a higher proportion of annual revenue. For many companies at that scale, a breach of that size is not a manageable setback. It strains cash flow, disrupts customer relationships, and can do reputational damage that takes years to undo. For organizations below $100M in revenue, a significant breach carries real closure risk. Insurers have started pricing that in, scrutinizing smaller organizations’ security postures before writing policies. Cyber insurance premiums rose 28% between 2022 and 2025 for mid-market companies, with exclusions widening to cover certain ransomware payments and incidents tied to unpatched known vulnerabilities.
Regulatory penalty exposure has expanded too. GDPR fines for breach-related violations grew 42% in total value between 2023 and 2025, with several large awards pulling the aggregate up. U.S. state privacy laws add a parallel domestic layer. The patchwork creates compliance complexity for any nationally operating organization, because notification timing, covered-data definitions, and penalty structures vary by state. Companies managing breach response across jurisdictions now routinely retain legal counsel in several states at once to coordinate obligations.
Detection Speed, Containment, and Cost Mitigation Factors
The most reliable predictor of breach cost is dwell time, meaning how long an attacker sits in the environment before being caught and contained. Breaches identified within 100 days cost an average of $3.1M. Those caught after 200 days averaged $5.5M. The relationship is not just about duration. Longer dwell times usually mean the attacker has moved laterally, escalated privileges, and reached more systems and data. Damage compounds with time, which makes early detection worth more than nearly any other security investment.
Mean time to identify and contain a breach averaged 292 days globally in 2025, down from 327 in 2022. The improvement is meaningful but still means almost ten months of attacker presence in the average compromised environment. The organizations dragging that average down run mature security operations centers, automated threat detection, and rehearsed response playbooks. The ones dragging it up have no dedicated security team, so breaches surface through outside parties, customers, or law enforcement rather than internal monitoring.
AI-driven security tools are the single biggest cost lever in the current data. Organizations with extensive AI and automation in their security operations show breach costs $1.76M lower than those without, the largest single-variable differential in the IBM dataset. It works through two channels: faster detection, with AI flagging anomalous behavior in hours rather than weeks, and more efficient response, with automated playbooks containing threats faster than manual workflows.
Zero-trust architecture correlates with a 27% reduction in average breach cost. The mechanism is reduced lateral movement. If an attacker compromises one credential or endpoint, the blast radius stays small because reaching other systems requires separate verification. Organizations that have fully implemented zero-trust report not just lower cost per breach but fewer breaches reaching the severity that triggers formal classification.
Incident response planning and regular tabletop exercises cut average breach cost by about $2.7M versus organizations without tested plans. The value is not in the document. It is in the organizational muscle memory of having rehearsed. Teams that have practiced make faster containment calls, coordinate better with legal and communications, and skip the improvisation tax that hits when the first real breach is also the first real response.
Leading Platforms in This Space
CrowdStrike leads endpoint detection and response with its Falcon platform, processing over 2 trillion security events daily. Its cloud-native architecture and threat intelligence have made it the default EDR choice for enterprise and upper mid-market organizations.
Palo Alto Networks offers the broadest cybersecurity platform across network security, cloud security, and security operations, with annual revenue above $7B.
Microsoft Security is now the largest cybersecurity vendor by revenue, using integration with Azure, Microsoft 365, and Windows to embed security tooling across enterprise environments.
Fortinet leads in unified threat management and network security appliances, with particular strength in mid-market and distributed enterprise deployments.
Zscaler is the leading cloud security platform for zero-trust network access, replacing traditional VPNs with cloud-delivered secure access.
SentinelOne competes directly with CrowdStrike in EDR and XDR, with autonomous response that reduces reliance on SOC analysts.
Okta leads identity and access management, providing the authentication and authorization layer underneath zero-trust architectures for over 18,000 enterprise customers.
Cloudflare provides web application security, DDoS protection, and zero-trust access, with a network spanning over 300 cities globally.
Splunk (Cisco) remains the dominant SIEM platform, providing the log aggregation and analysis layer security teams rely on for threat detection.
Proofpoint leads email security and human-centric security, taking on the phishing and social engineering vector that still opens 41% of breaches.
Platform Comparisons and Alternatives
Platform-native security (Microsoft Defender, Google Chronicle) versus best-of-breed stacks is a trade-off between integration convenience and specialized depth. Organizations standardized on Microsoft can deploy Defender, Sentinel, and Entra ID quickly at lower incremental cost, but often find specialized vendors outperform in specific domains like endpoint detection accuracy or email filtering.
Cloud security posture management tools like Wiz, Orca, and Palo Alto’s Prisma Cloud compete on finding misconfigurations and vulnerabilities across multi-cloud environments. Wiz has gained real traction since 2023 with agentless scanning that surfaces risk across cloud workloads without deploying endpoint agents.
Managed detection and response versus an in-house SOC is a build-versus-buy call that increasingly favors MDR for organizations below 5,000 employees. An effective internal SOC needs 8 to 12 analysts at a fully loaded $150K to $200K each per year, which puts it out of reach for most mid-market budgets.
The Outlook Into 2027
AI will reshape both sides of the equation at once. Defensive AI will keep compressing detection and response times, but offensive AI will produce more convincing social engineering, automate vulnerability discovery, and let attackers operate at greater scale with fewer people. Through 2027 the likely net effect is attack volume rising faster than defenses improve, which means breach frequency keeps climbing even as detection gets better.
Regulatory compliance costs will take a bigger share of total breach costs. Expanding state privacy laws in the U.S., maturing GDPR enforcement, and emerging AI-specific rules will add cost to every breach regardless of technical severity. Organizations that invest in compliance automation and breach response orchestration will hold a structural cost advantage over those handling obligations manually.
Supply chain security will become a board-level priority and a vendor selection criterion. The frequency and impact of these breaches will push organizations to require security attestations, software bills of materials, and continuous third-party monitoring as conditions of doing business. Vendors that cannot meet those terms will lose contracts.
Cyber insurance will keep tightening. Underwriters will increasingly demand evidence of specific controls, including MFA, endpoint detection, backup verification, and incident response planning, as conditions of coverage. Premium discounts for demonstrable security maturity will widen the cost gap between well-defended and poorly-defended organizations.
Methodology
Breach cost data here draws primarily on IBM Security and the Ponemon Institute’s annual Cost of a Data Breach report, supplemented by Verizon’s Data Breach Investigations Report for attack vector and frequency analysis. Ransomware economics incorporate findings from Coveware, Chainalysis, and incident response firm reporting. Regulatory penalty data comes from GDPR enforcement tracker databases and state attorney general disclosures. Platform and vendor data draws on public filings, Gartner market share estimates, and IDC security spending forecasts.
The Bottom Line
The breach cost trajectory from 2023 through 2026 describes a market where attack sophistication, attack volume, and regulatory exposure are all rising together. The organizations holding their cost exposure down are the ones investing in detection speed through AI-driven security operations, shrinking blast radius through zero-trust, and building response capability through tested incident response programs. The gap between well-defended and poorly-defended organizations is widening in cost terms, and the insurance market is starting to formalize it into premiums. For mid-market organizations especially, the decision to invest in security is no longer just risk management. It is a business continuity decision.
We operate independently with no outside influence, ensuring every insight is grounded in objective analysis.
Independent research.
Clear insights.
Smarter decisions.
Contact